Grafana Alerts with Telegram
Prerequisites
Prometheus data source working in Grafana & a Telegram account. To get alerts it is best to have Grafana on a Pi in another location or on a vps. This way if your internet goes down you will still be alerted.
What I do is connect Grafana to a Prometheus endpoint through a Wireguard VPN on my core. I have a local Grafana and a remote Grafana using the same data source. One dashboard on the remote Grafana has alerts that use Telegram.
Create a Telegram bot
Go to https://t.me/botfather in Telegram and create a new bot and give it a name and username, then copy your API access token.
/newbot
Grafana_Alerts
my__pool__bot
Something like that. Get creative.
Create a Telegram group
In Telegram you can create a group by clicking on the :pencil:symbol next to the search bar. You can go back and add an image and change the name later.
Add your bot to the new group
Return to Bot Father if you need a link to your bot or if you need the api token.
Open botfather Follow the t.me link to your bot. Start to enable the bot and click on the three dots and 'Add to Group'. Add your bot to your new group.
Find your groups Chat ID
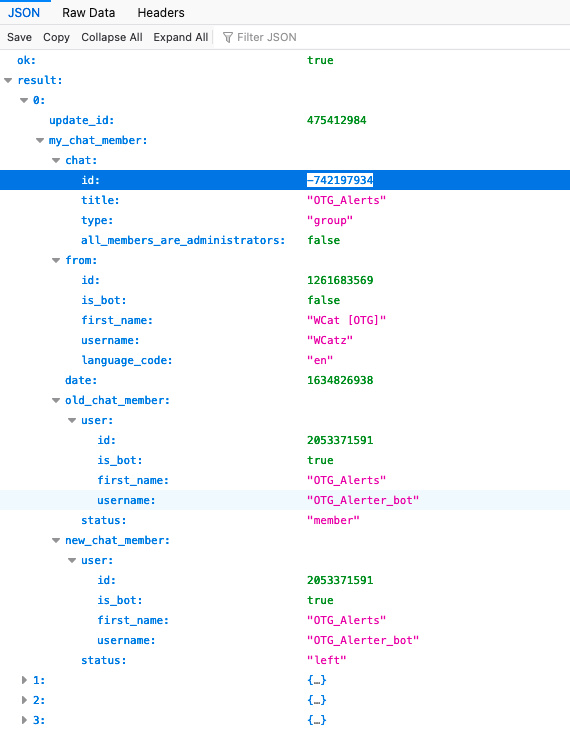
You may have to post in your new group if you cannot find the chat.id that starts with a - sign. Also Firefox displays the json returned in an easier to read format than Chrome.
Paste your bots API token into the url below. Determine your Chat ID. Starts with - sign like below.
https://api.telegram.org/bot\<YOUR BOT API TOKEN>/getUpdates
Create a notification channel in Grafana
Click the bell icon in Grafanas left hand vertical menu and choose notification channels. Choose 'Add channel'. Give it a name and choose Telegram under type. Enter the token and the chat id value you copied earlier. Click test and you should get a green 'test notification sent' and a message in your new group. If so go ahead and click save.
Add profile image for your bot
Return to botfather and type /setuserpic choose your bot and click the paperclip icon to choose the image.
Add a dashboard for monitoring
Grafana Alerts are only available for 'time series' & 'graph (old)' type panels, not always how we would look at the data. Let's create a new dashboard with graph type panels we need for alerts.
I am currently working on an alerts dashboard that can be added to Grafana and will add it to the dashboards repo when it is ready. Please feel free to share your dashboard with the alliance.