Securing Stake pool Connections & Monitoring with Tailscale
This guide will demonstrate how to use Tailscale to manage a WireGuard VPN, securely connecting your block producer and relays. You will learn to scrape data with Prometheus and display it using Grafana within the VPN, without the need to manage TLS certificates or opening any ports except the public ports for your relays.
Additionally, the guide covers setting up Grafana alerts and configuring notifications to be sent to a Telegram bot. This bot can then be added to a Telegram group for real-time alerting.
More information on the various notification contact points supported by Grafana, including Telegram, Email, Discord, and others.
It is best to have Grafana and Prometheus on their own dedicated machine outside of the block producers local network or set them up on a relay looking in. This way you can be alerted if the BP loses connectivity.
You can also have several instances of Grafana on different machines using the same Prometheus data source. I do this so I can always have Grafana locally for my viewing pleasure. It loads a lot faster when it's local 😎. Alerting only needs to be setup on the one looking in.
Creating a Tailscale VPN
Head over to the Tailscale quick start page, create an account and start adding machines. Start by adding your local machine or laptop. It is very easy to install Tailscale on your machines just follow the instructions. You can also install it on your phone to view dashboard on the go.
This guide will also make your block producer "portable". Meaning you can connect your block producer to the internet from anywhere and it will instantly reestablish communication with your relays without further configuration ⚡.
Adding Machines
Follow the instructions for adding the nodes that make up your pool and a machine to host Grafana. This does not have to be a separate machine, though as mentioned above, it's preferable to have it looking in at the block producer. This way, if the BP goes offline, you will still be able to receive alerts.
Installing Tailscale on Ubuntu is just running the below script then visiting the link that is output to terminal and authorizing the machine on the Tailscale website.
curl -fsSL https://tailscale.com/install.sh | sh
You will see a new tailscale0 network interface added to each machine. You can control traffic to these interfaces
with iptables, UFW, or Firewalld on the tailscale0 interface. Additionally, you can use Tailscale's ACL feature to group machines and control which
ports are open between machines in that group.
ip a
Disable Key Expiry
Failure to disable key expiry will knock your pool offline when they expire after 180 days. Don't skip this step. You have been warned.
Once the machines are added you should disable key expiry on each machine or the keys used to connect to the VPN will expire after 180 days and those nodes will be unable to connect. You can do this on the Tailscale website by clicking the ... for each machine and choosing 'Disable key expiry'. You can always generate new keys at any time if you wish. If you do get locked out you can toggle the expiry on the website and restart the server to get back into it.
Access Control layer
Click the 'Access controls' tab on the Tailscale website. By default there is a rule to allow all traffic on all ports between the machines in the tailnet. This is fine to get started but know you have the ability to group machines and only allow certain ports to communicate through the VPN to machines in that group. For example I have a mainnet and a testnet group and only allow the ports needed for those machines.
        // my laptop does what it wants
		{"action": "accept", "src": ["tag:kingOfKings"], "dst": ["*:*"]},
		{
			"action": "accept",
			"src":    ["autogroup:members"],
			"dst":    ["autogroup:internet:*"],
		},
		{ // mainnet machines can communicate on said ports
			"action": "accept",
			"src":    ["tag:cardano-mainnet"],
			"dst": ["tag:cardano-mainnet:6000-6003,9090,5000,12798,12800,9100,9190,3000,1337,9615"],
		},
		{ // testnet machines can communicate on said ports
			"action": "accept",
			"src":    ["tag:cardano-testnets"],
			"dst":    ["tag:cardano-preview:3000-3003,9090,5000,12798,12800,9100,22"],
		}
This is just an example of what my groups look like. Consult the documentation on ACL when you are ready to tighten up access. Be aware that ports are closed by default and that one default rule is what is allowing communication for all machines on all ports.
Update cardano-node topology files.
You can get a list of the machine names, IP address' and some other connection info of the machines in your 'tailnet' from their website or by running..
sudo tailscale status
You can remove HOSTADDR=0.0.0.0 entirely from your cardano-node startup script(if present) to enable connections using Tailscale's IPv6 address'. cardano-node will use both IPv4 and IPv6 if that line is not present.
Let's test communication. When you setup Tailscale it creates a nameserver that the VPN can use to resolve machine hostnames to their VPN IP address. You should be able to ping or SSH to the IPv4, IPv6 address or machine name of a node from other machines in the VPN. You can also use cardano-cli to test they can connect before editing your topology files.
cardano-cli ping -h <Tailscale IP or Tailscale DNS name> -p <port>
Test this out on each machine. You can then go in to your cardano-node topology file and update all the address to their Tailscale IP.
Example with block producer & backup block producer in localRoots using the tailscale0 interface IPv4.
    "localRoots": [
    { "accessPoints": [
      { "address": "100.90.109.57", "port": 6000, "name": "My core" },
      { "address": "100.118.76.131", "port": 6000, "name": "Backup core" }
      ],
      "advertise": false,
      "trustable": true,
      "valency": 2
    },
    ]
Monitoring
We first need to tell cardano-node to have the metrics available to all interfaces and not just localhost. This way Prometheus will be able to access the metrics when they are on another machine in the VPN. Open cardano-node's config.json and update the hasPrometheus section like this. Do this for all the machines running cardano-node. Keep in mind you'll need to do this every time you pull in a new config.json when upgrading.
  "hasPrometheus": [
    "0.0.0.0",
    12798
  ],
Next make sure you have prometheus-node-exporter installed on every machine you plan to add to the dashboard.
sudo apt install prometheus-node-exporter
sudo systemctl enable prometheus-node-exporter.service
Prometheus & Grafana
Prometheus scrapes data from cardano-node and the Linux host with node exporter and serves the scraped metrics over http. Grafana in turn can use that data to display graphs and create alerts etc. Our Grafana dashboard will be made up of data from our Ubuntu system(prometheus-node-exporter) & cardano-node.
Install Prometheus.
sudo apt install prometheus
Configure Prometheus
Open prometheus.yml.
sudo nano /etc/prometheus/prometheus.yml
Indentation must be correct YAML format or Prometheus will fail to start.
Replace the contents of the file with below make sure you fill in the Tailscale ipv4 address for each machine twice. Once for cardano-node metrics and then again for prometheus node exporter metrics. Which is just server metrics like RAM, CPU etc.
If you have other machines or services you would like to add to your dashboard you can add them here. Mithril, Aya devnet, testnets etc.
global:
  scrape_interval:     5s # By default, scrape targets every 15 seconds.

  # Attach these labels to any time series or alerts when communicating with
  # external systems (federation, remote storage, Alertmanager).
  external_labels:
    monitor: 'codelab-monitor'

# A scrape configuration containing exactly one endpoint to scrape:
# Here it's Prometheus itself.
scrape_configs:
  # The job name is added as a label job=<job_name> to any timeseries scraped from this config.
  - job_name: 'prometheus' # To scrape data from the cardano node
    scrape_interval: 5s
    static_configs:

    # cardano-node metrics

      - targets: ['<primary core ip addr>:12798']
        labels:
          alias: 'C1'
          type:  'cardano-node'

      - targets: ['<backup core ip addr>:12798']
        labels:
          alias: 'C2'
          type:  'cardano-node'

      - targets: ['<relay 1 ip addr>:12798']
        labels:
          alias: 'R1'
          type:  'cardano-node'

      - targets: ['<relay 2 ip addr>:12798']
        labels:
          alias: 'R2'
          type:  'cardano-node'

      - targets: ['<relay 3 ip addr>:12798']
        labels:
          alias: 'R3'
          type:  'cardano-node'

    # prometheus node exporter metrics

      - targets: ['<primary core ip addr>:9100']
        labels:
          alias: 'C1'
          type:  'node'

      - targets: ['<backup core ip addr>:9100']
        labels:
          alias: 'C2'
          type:  'node'

      - targets: ['<relay 1 ip addr>:9100']
        labels:
          alias: 'R1'
          type:  'node'

      - targets: ['<relay 2 ip addr>:9100']
        labels:
          alias: 'R2'
          type:  'node'

      - targets: ['<relay 3 ip addr>:9100']
        labels:
          alias: 'R3'
          type:  'node'
Save & exit.
Start Prometheus, you can check if it's running and follow the services logs with.
sudo systemctl start prometheus.service
sudo systemctl status prometheus.service
journalctl -u prometheus.service -f
If everything looks good tell Systemd to start the service at boot.
sudo systemctl enable prometheus.service
You can now open the browser on your laptop if Tailscale is installed on it and got to http://prometheus-server-ip:9090
Install Grafana
Install the prerequisite packages.
sudo apt install -y apt-transport-https software-properties-common wget
Import Grafana's gpg key to Ubuntu.
sudo mkdir -p /etc/apt/keyrings/
wget -q -O - https://apt.grafana.com/gpg.key | gpg --dearmor | sudo tee /etc/apt/keyrings/grafana.gpg > /dev/null
Add latest stable repo to apt sources.
echo "deb [signed-by=/etc/apt/keyrings/grafana.gpg] https://apt.grafana.com stable main" | sudo tee -a /etc/apt/sources.list.d/grafana.list
Update your package lists & install Grafana.
sudo apt update; sudo apt install grafana
Optionally, change the port on which Grafana listens to port 5000 to avoid clashes with cardano-node, which commonly uses port 3000.
sudo sed -i /etc/grafana/grafana.ini \
         -e "s#;http_port#http_port#" \
         -e "s#3000#5000#"
Start Grafana, you can check if it's running and follow the services logs with.
sudo systemctl start grafana-server.service
sudo systemctl status grafana-server.service
journalctl -u grafana-server.service -f
If everything looks good tell Systemd to start the service at boot.
sudo systemctl enable grafana-server.service
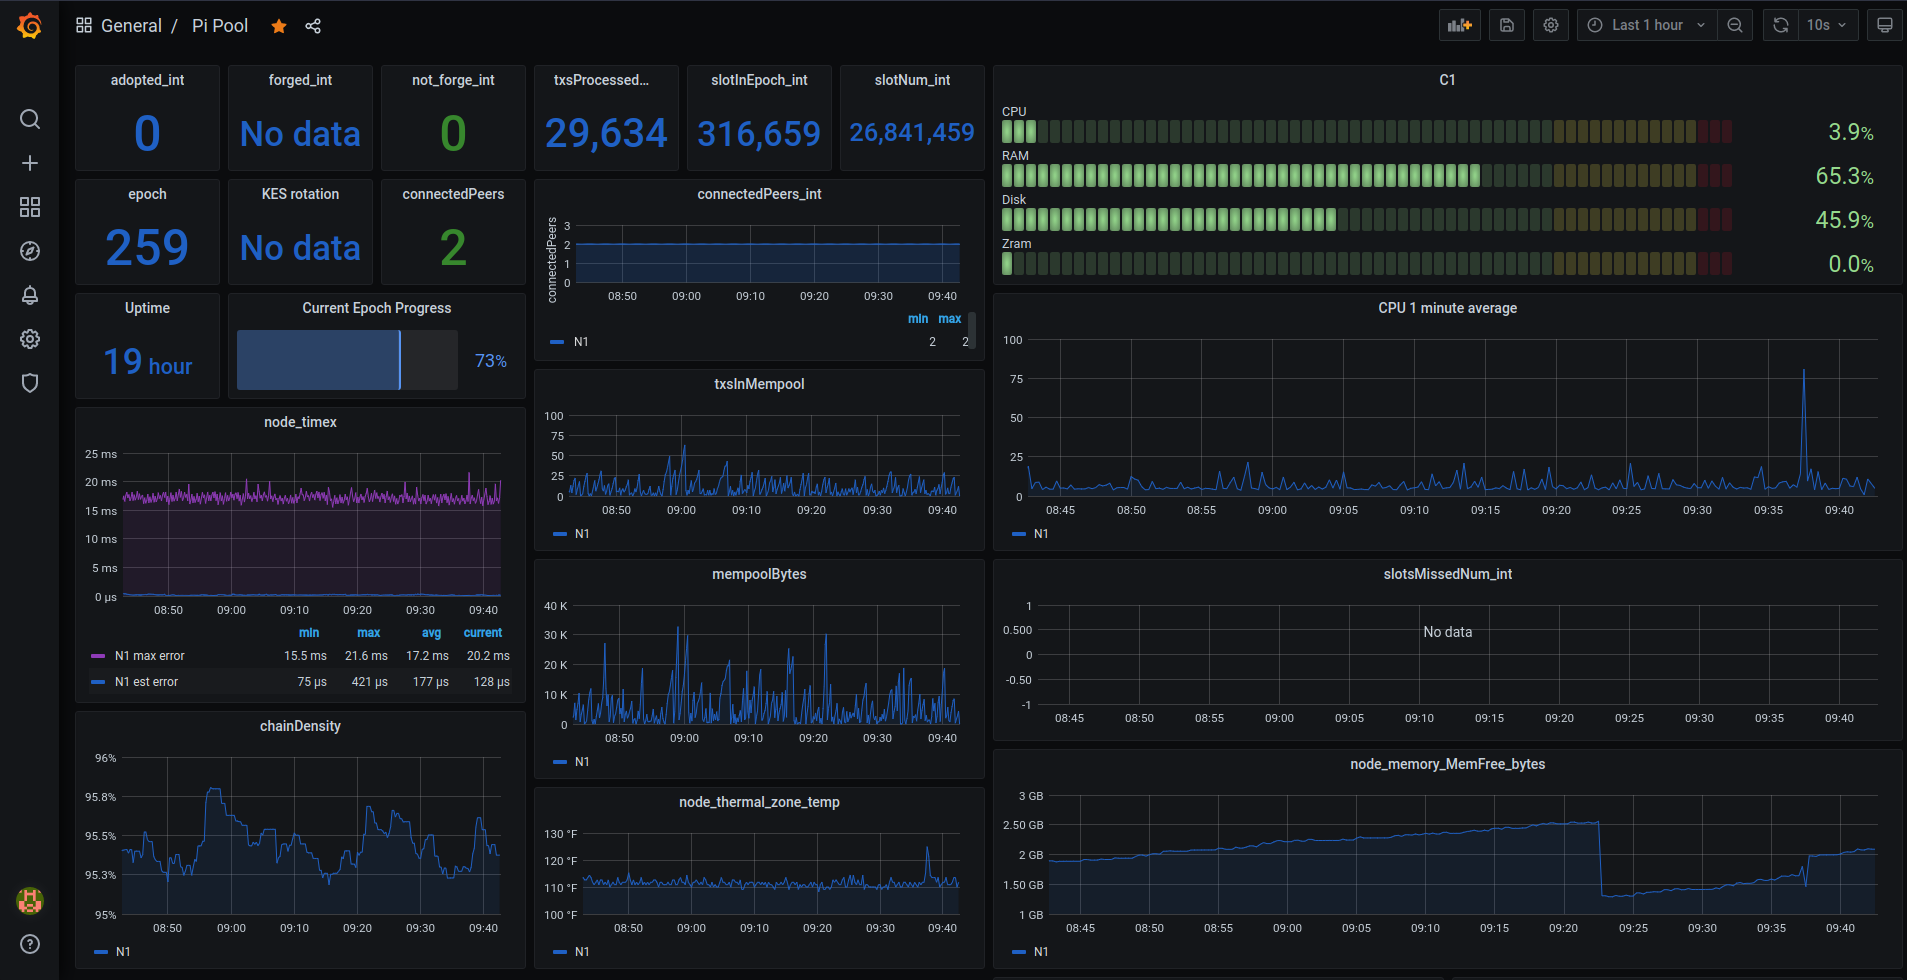
You should now be able to open Grafana with the Tailscale IP addr or hostname of the machine it is installed on from your local machine. Here is an example.
It will ask you to set a username and password on first log in. The next step is adding our Prometheus data source. In Grafana's sidebar find the data sources page. They have changed the URL/name a few times. For my installation it is http://100.120.233.29:3000/connections/datasources.
Click on 'Add new data source'. The only section we need to edit here is 'Prometheus server URL'. If Prometheus is on the same server as Grafana you can just add http://localhost:9090 then hit the Save & test button. If Prometheus is on a different server add it's Tailscale IP in place of localhost.
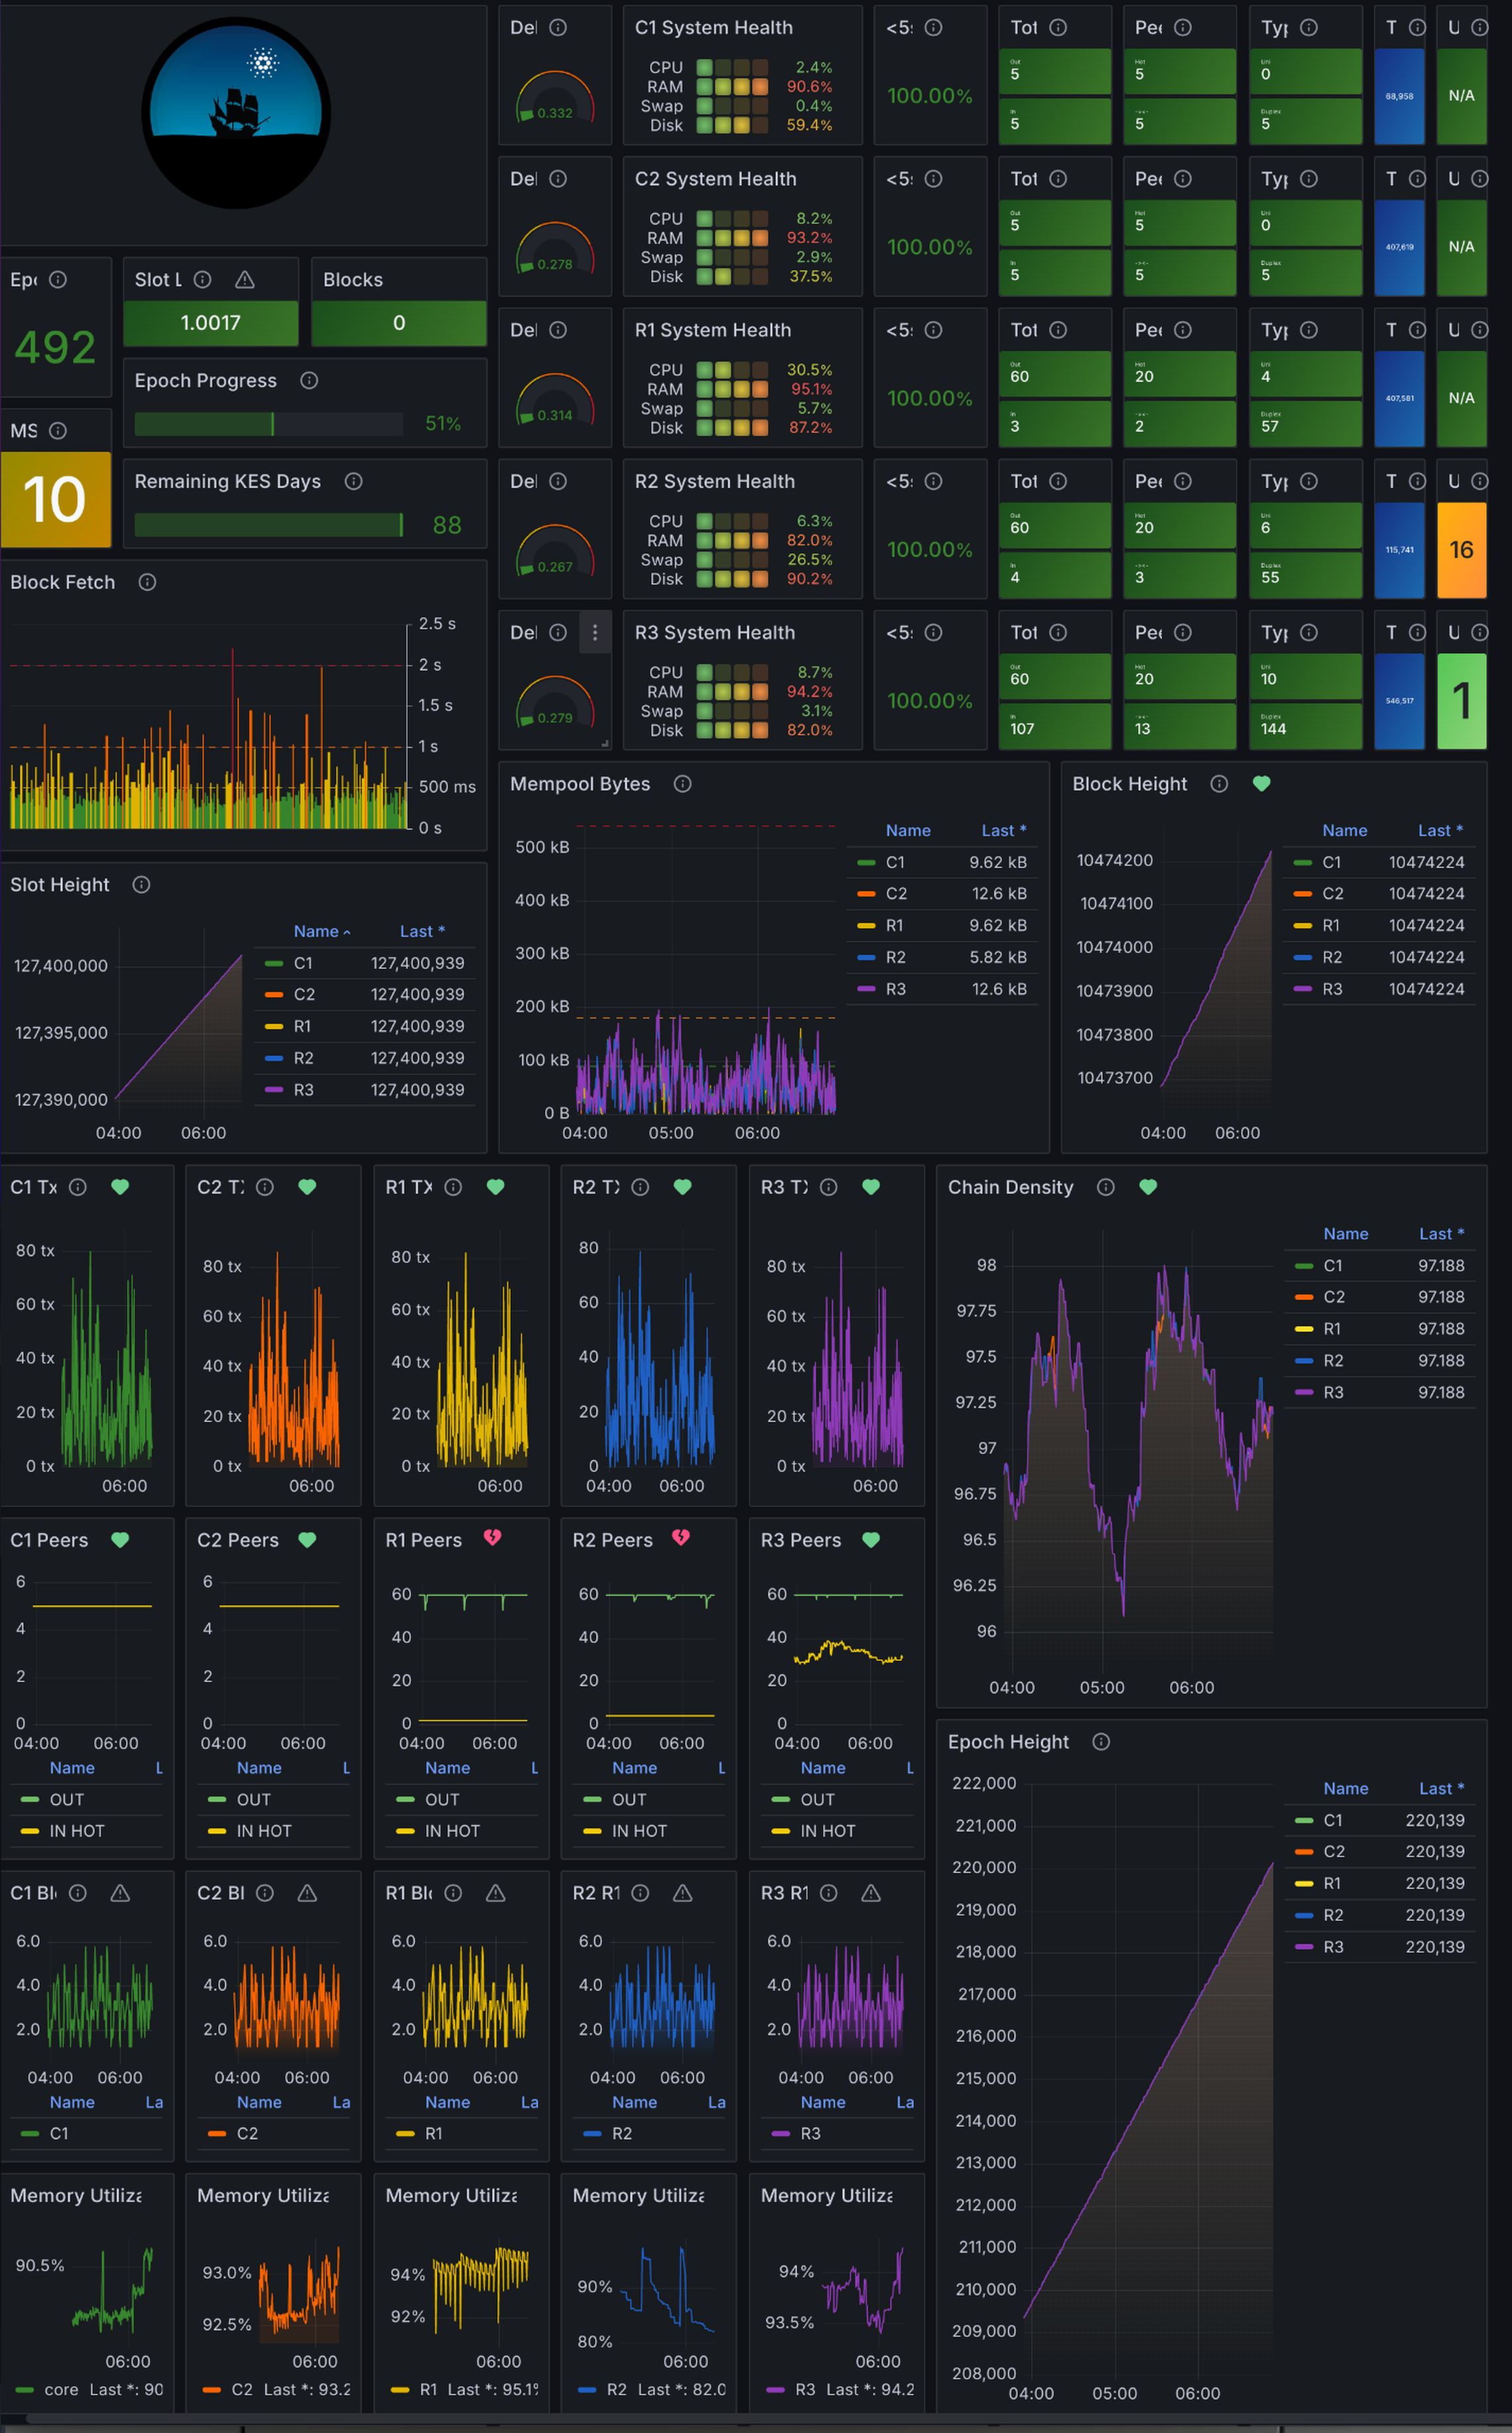
Dashboard/s
We can now grab the dashboard for this guide and import it into Grafana. Download this dashboard somewhere on your local machine. Next find the Dashboards tab in Grafana and click 'New' then 'Import'. Choose the dash you you just downloaded above.
If every things connected correctly you can now choose the dashboard from the Dashboards sidebar to view it.
Alerting to Telegram
Create a Telegram bot
Go to https://t.me/botfather in Telegram and create a new bot and give it a name and username, then copy your API access token.
/newbot
Grafana_Alerts
my__pool__bot
Something like that. Get creative.
Create a Telegram group
In Telegram you can create a group by clicking on the :pencil:symbol next to the search bar. You can go back and add an image and change the name later. You can also add the bot to an existing group/s.
Add your bot to the new group
Return to Bot Father if you need a link to your bot or if you need the api token.
Open botfather Follow the t.me link to your bot. Start/enable the bot and click on the three dots and 'Add to Group'. Add your bot to your new group.
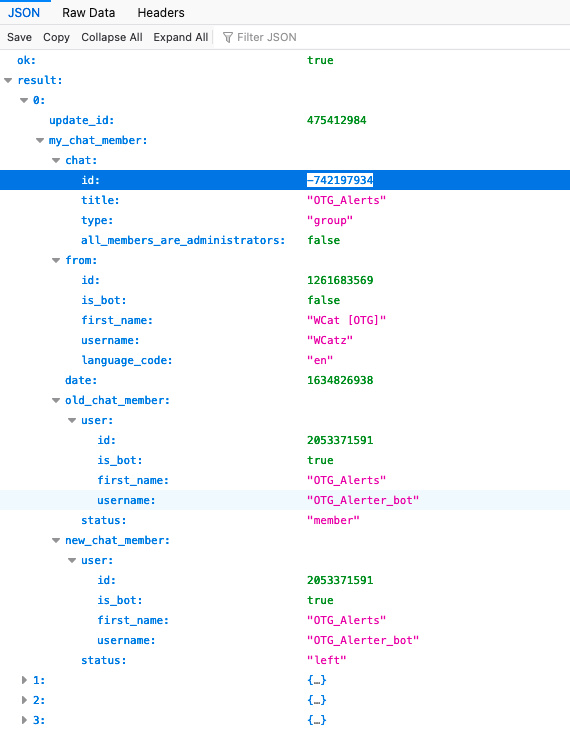
Find your groups Chat ID
You may have to post in your new group if you cannot find the chat.id that starts with a - sign. Also Firefox displays the json returned in an easier to read format than Chrome.
Paste your bots API token into the url below. Determine your Chat ID. Starts with - sign like below.
https://api.telegram.org/bot\<YOUR BOT API TOKEN>/getUpdates
Create a notification channel in Grafana
Click on Alerting in Grafana's left hand vertical menu and choose notification channels. Choose 'Contact Points'. Give it a name and choose Telegram under integration. Enter the token and the chat id value you copied earlier. Click test and you should get a green 'test notification sent' and a message in your new group. If so go ahead and click save.
Add profile image for your bot
Return to botfather and type /setuserpic choose your bot and click the paperclip icon to choose the image.
Creating Alerts
Unfortunately alerting rules do not export with the dashboard so we will have to go through setting alerts. I am going to show a few I have setup which is a good start and focuses only on alerting for cardano-node.
Specifically we will alert if a node is not receiving tx's into it's mempool, if the chains block height stalls and if peers drop below a set threshold. You can of course go crazy with it just remember sometimes less is more and you do not want a lot of noise on the alerts.
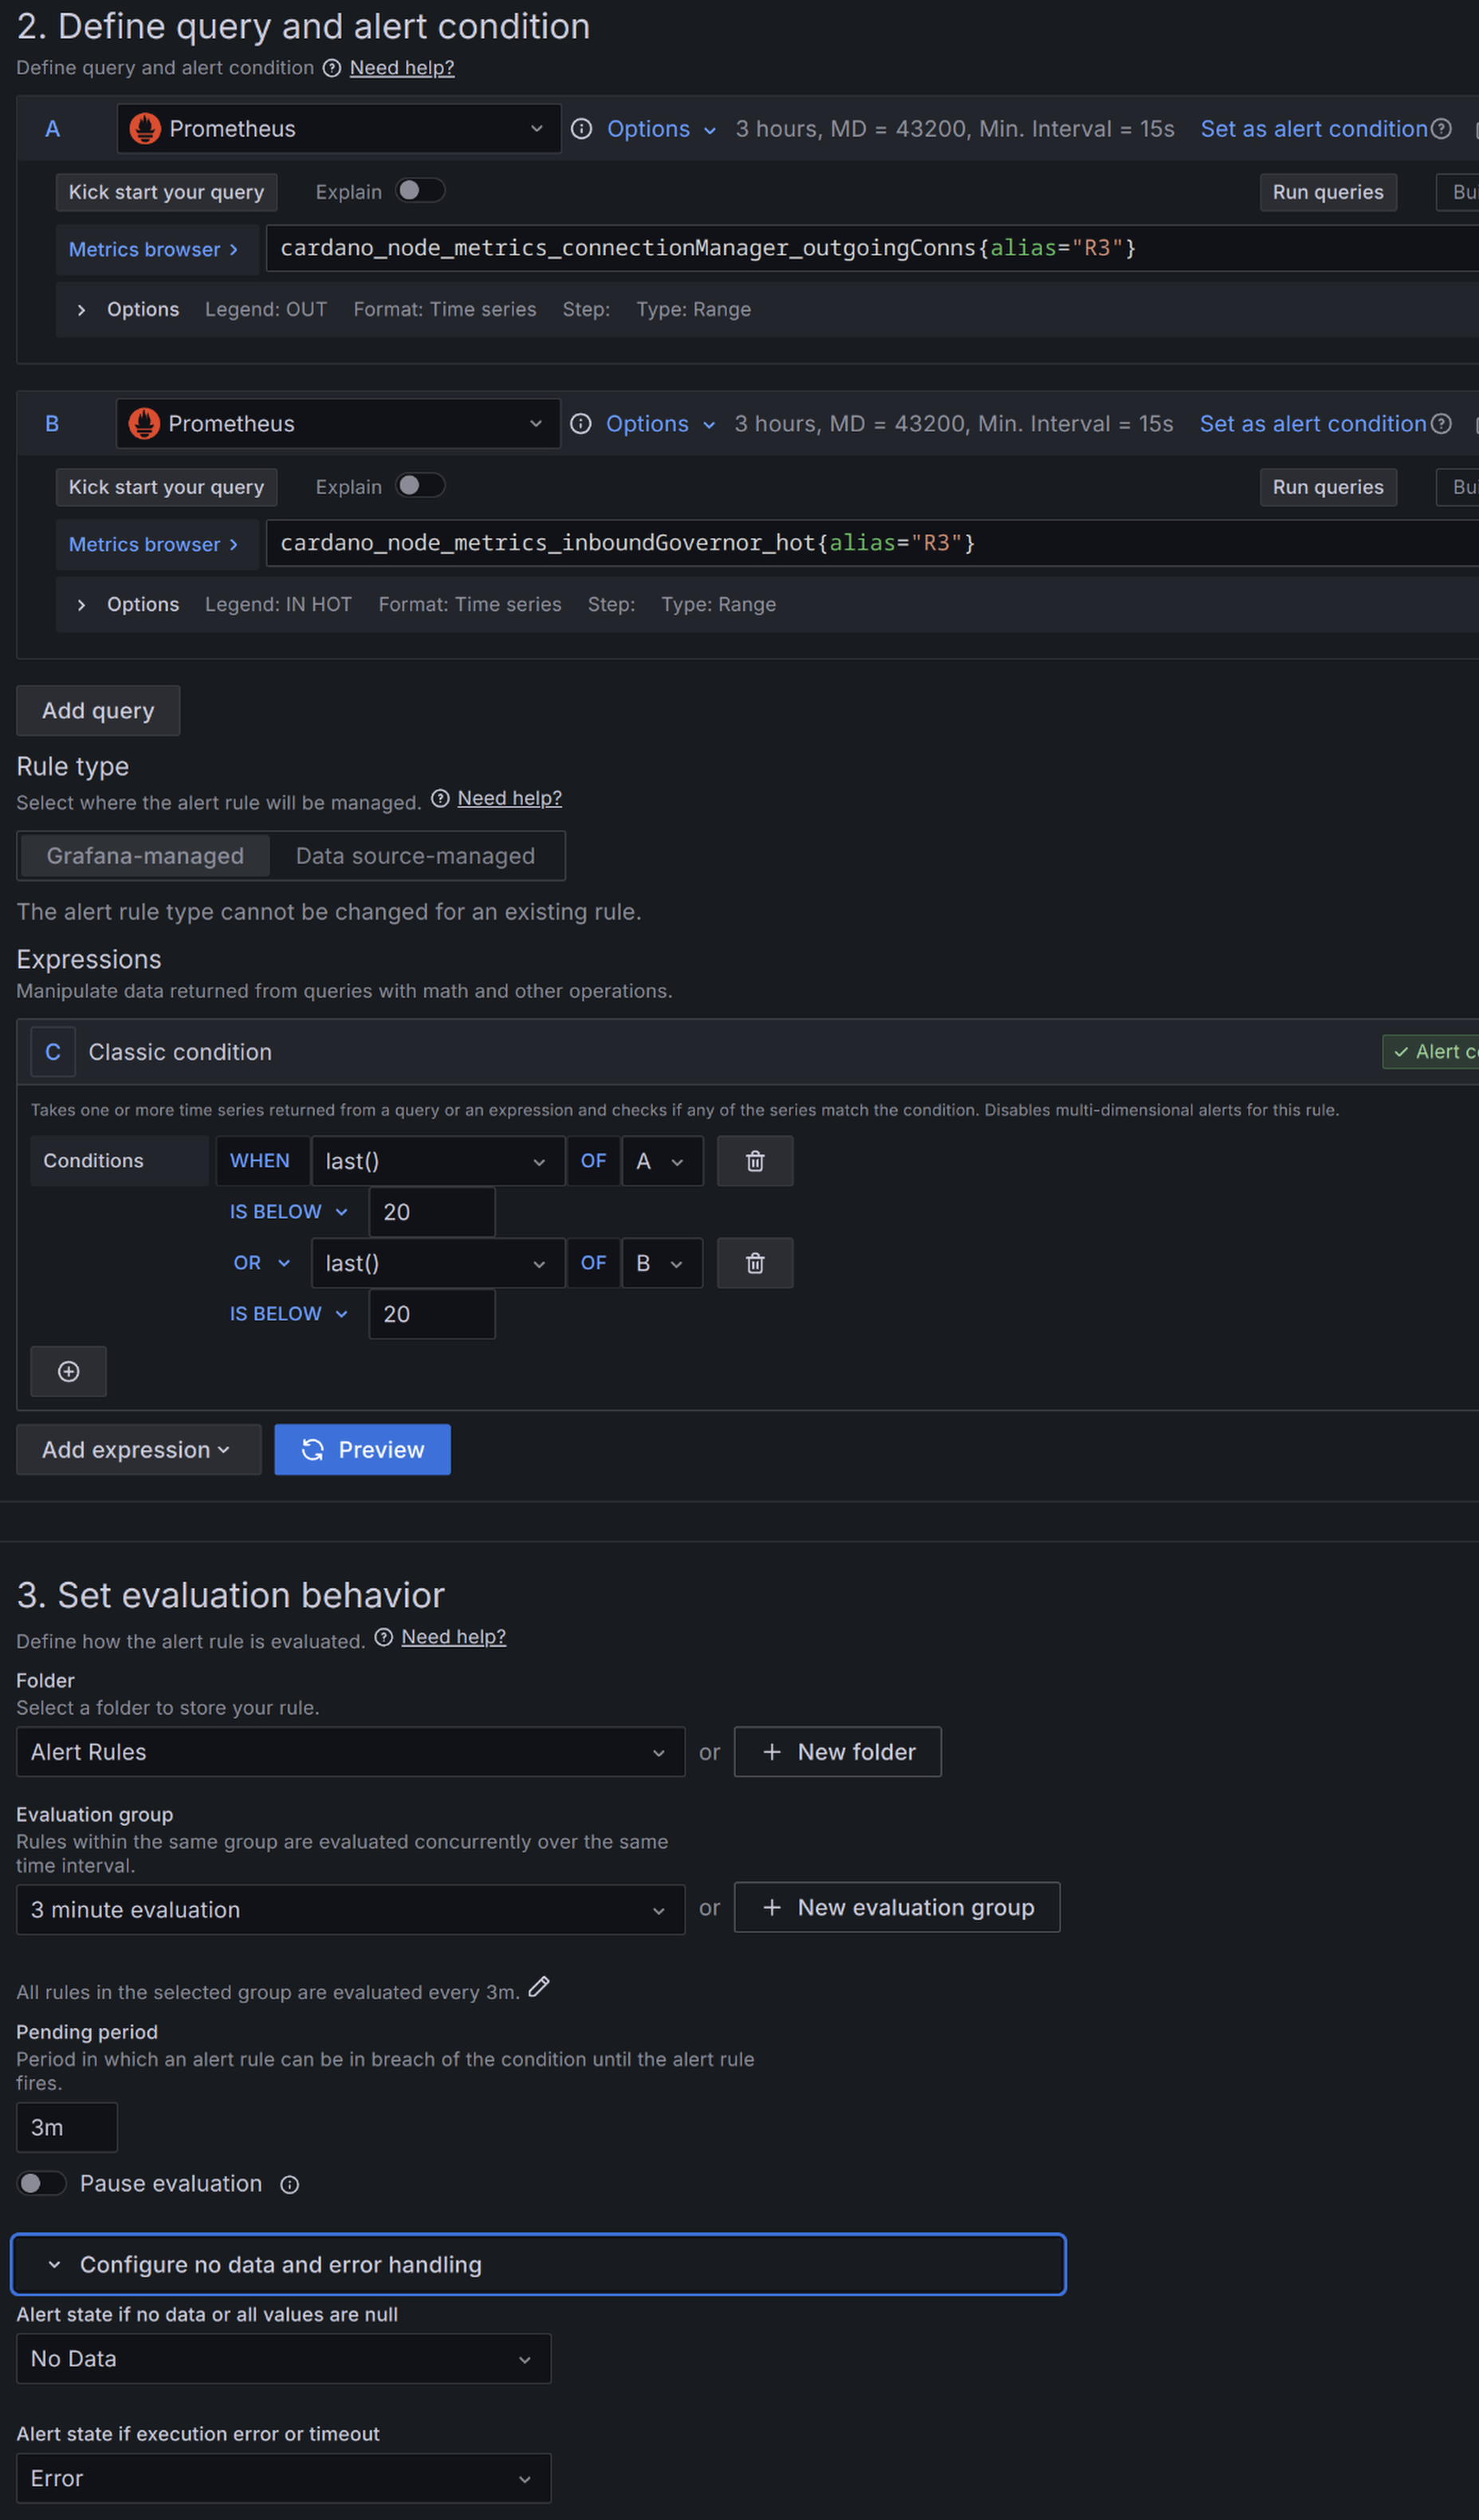
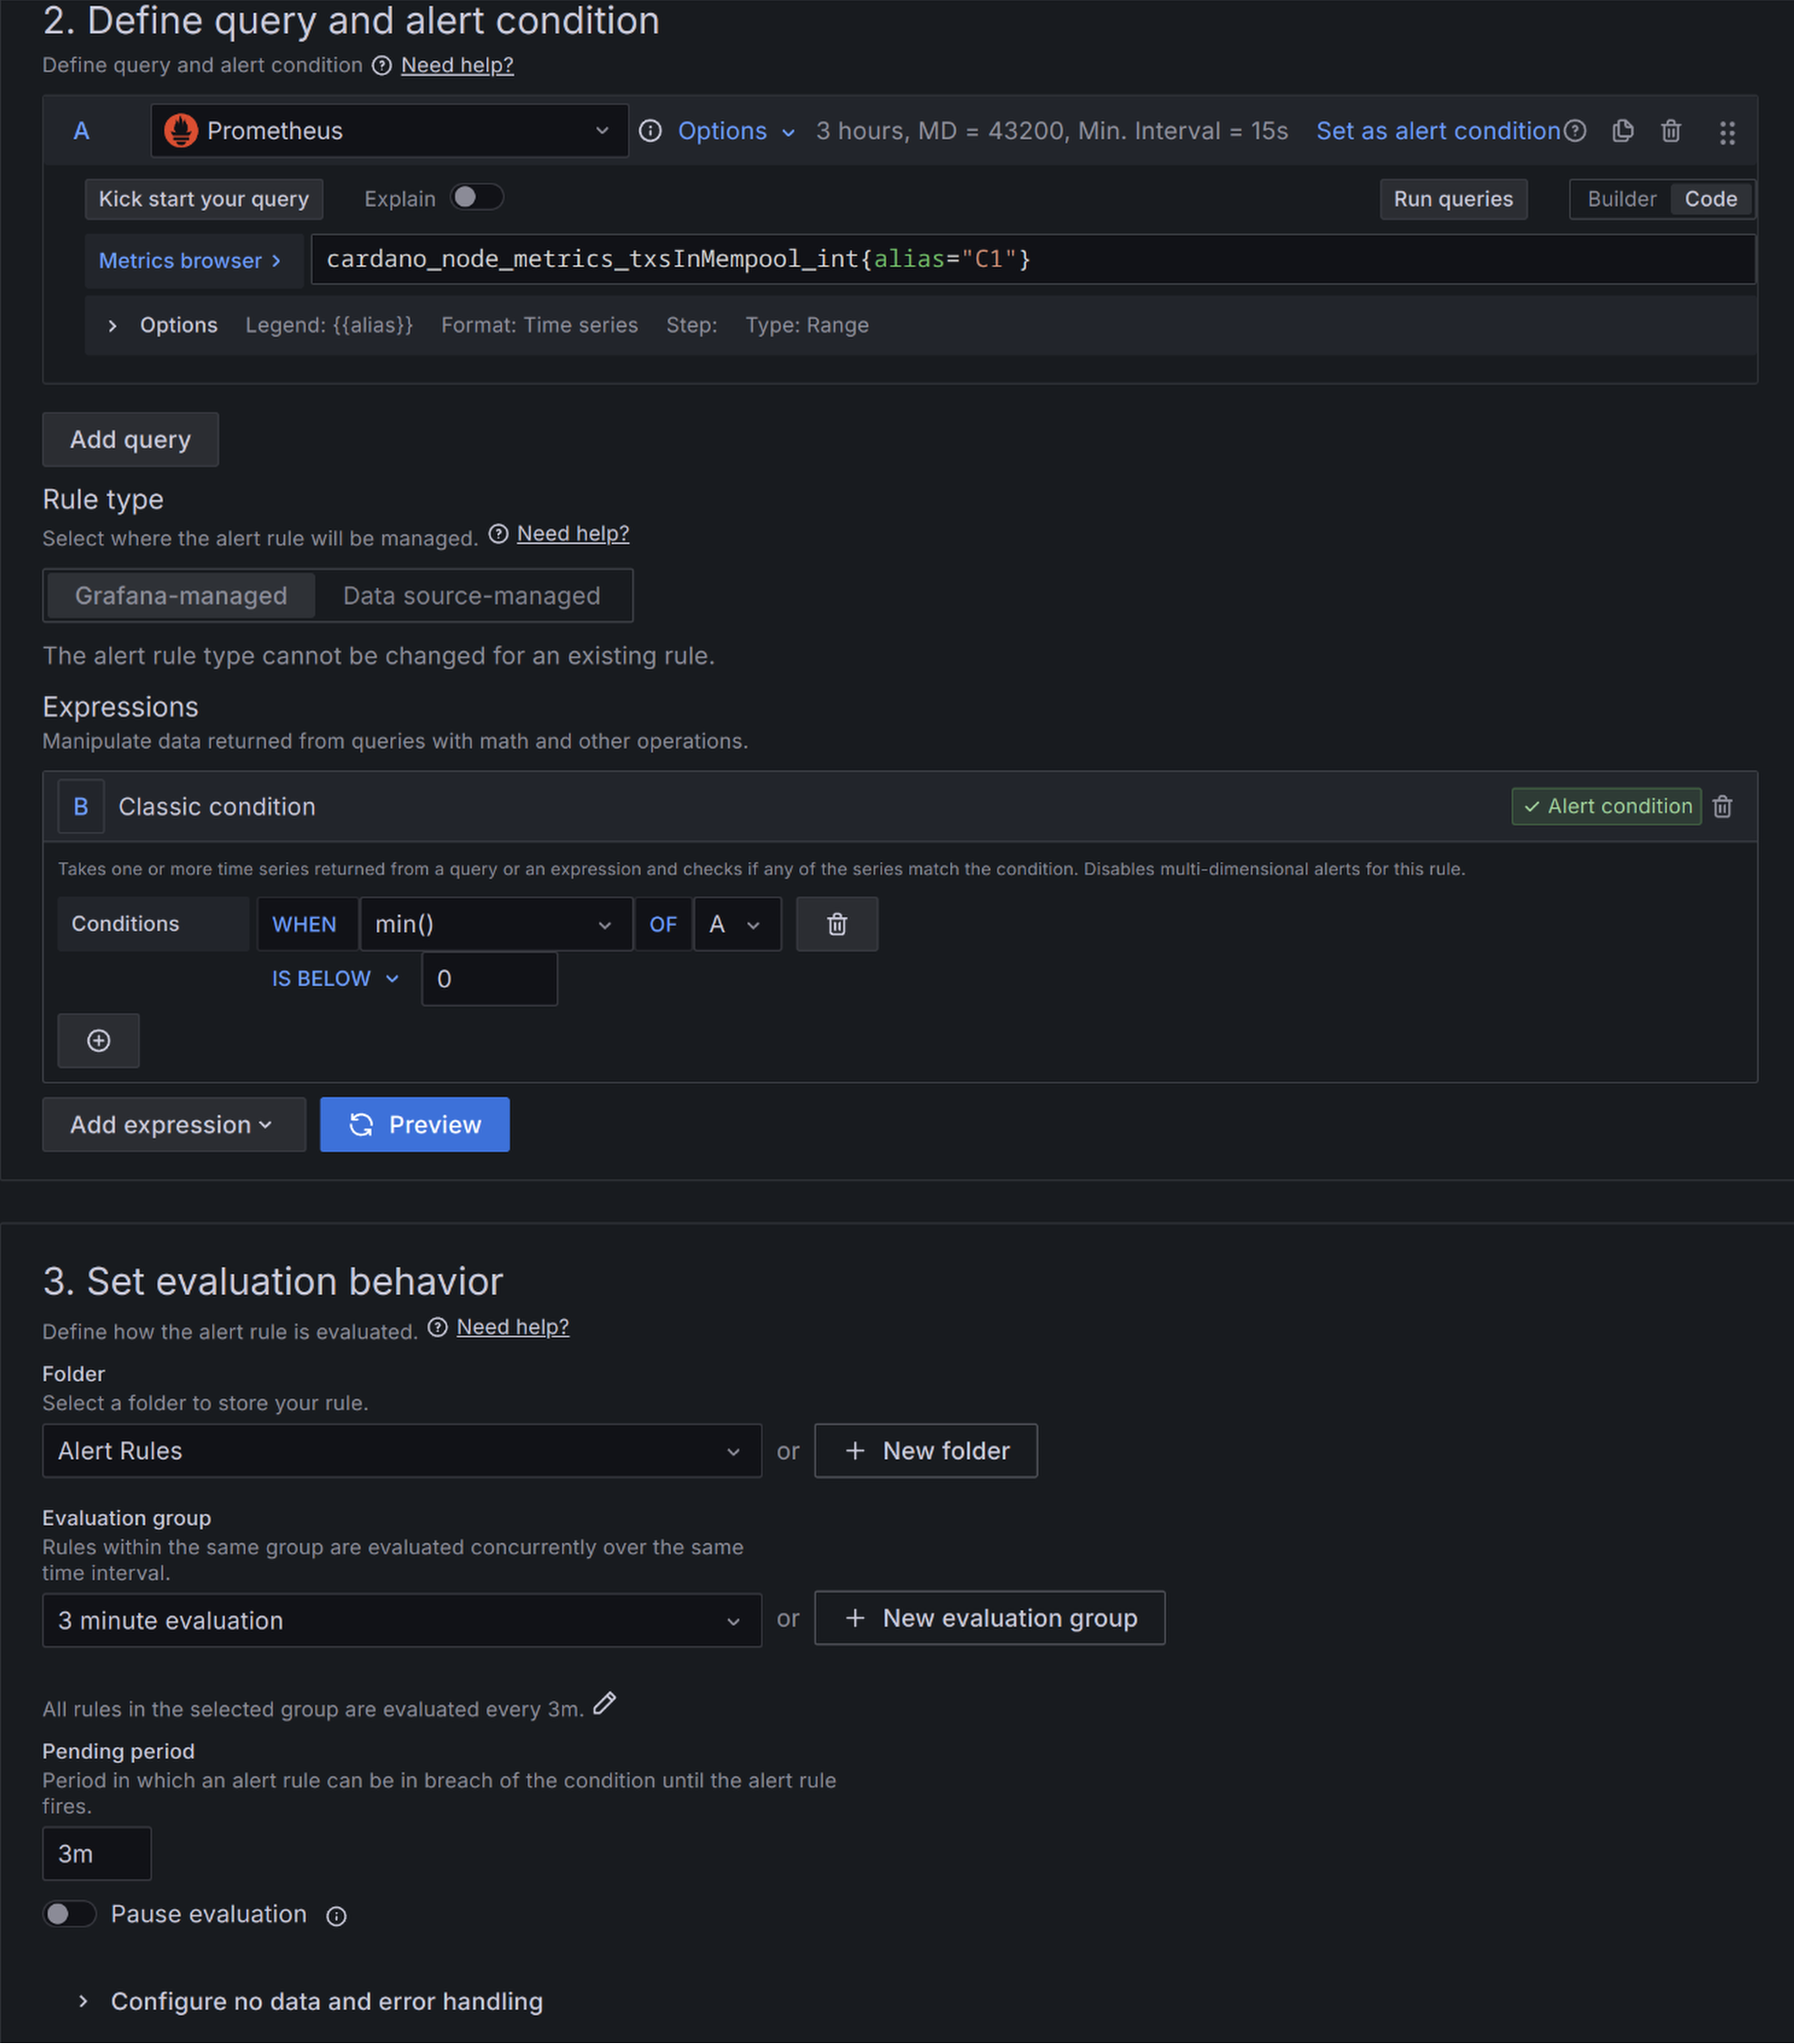
No tx's in mempool for 3 minutes.
Open the dashboard and edit the 'C1 Tx's in Mempool' panel. Click on the Alert tab just below the displayed metrics. Click on 'New alert rule' Give the rule a name. I used 'C1 Mempool tx'. Fill it in using the image below. Fill it in using the image below. You can then repeat this for each node.
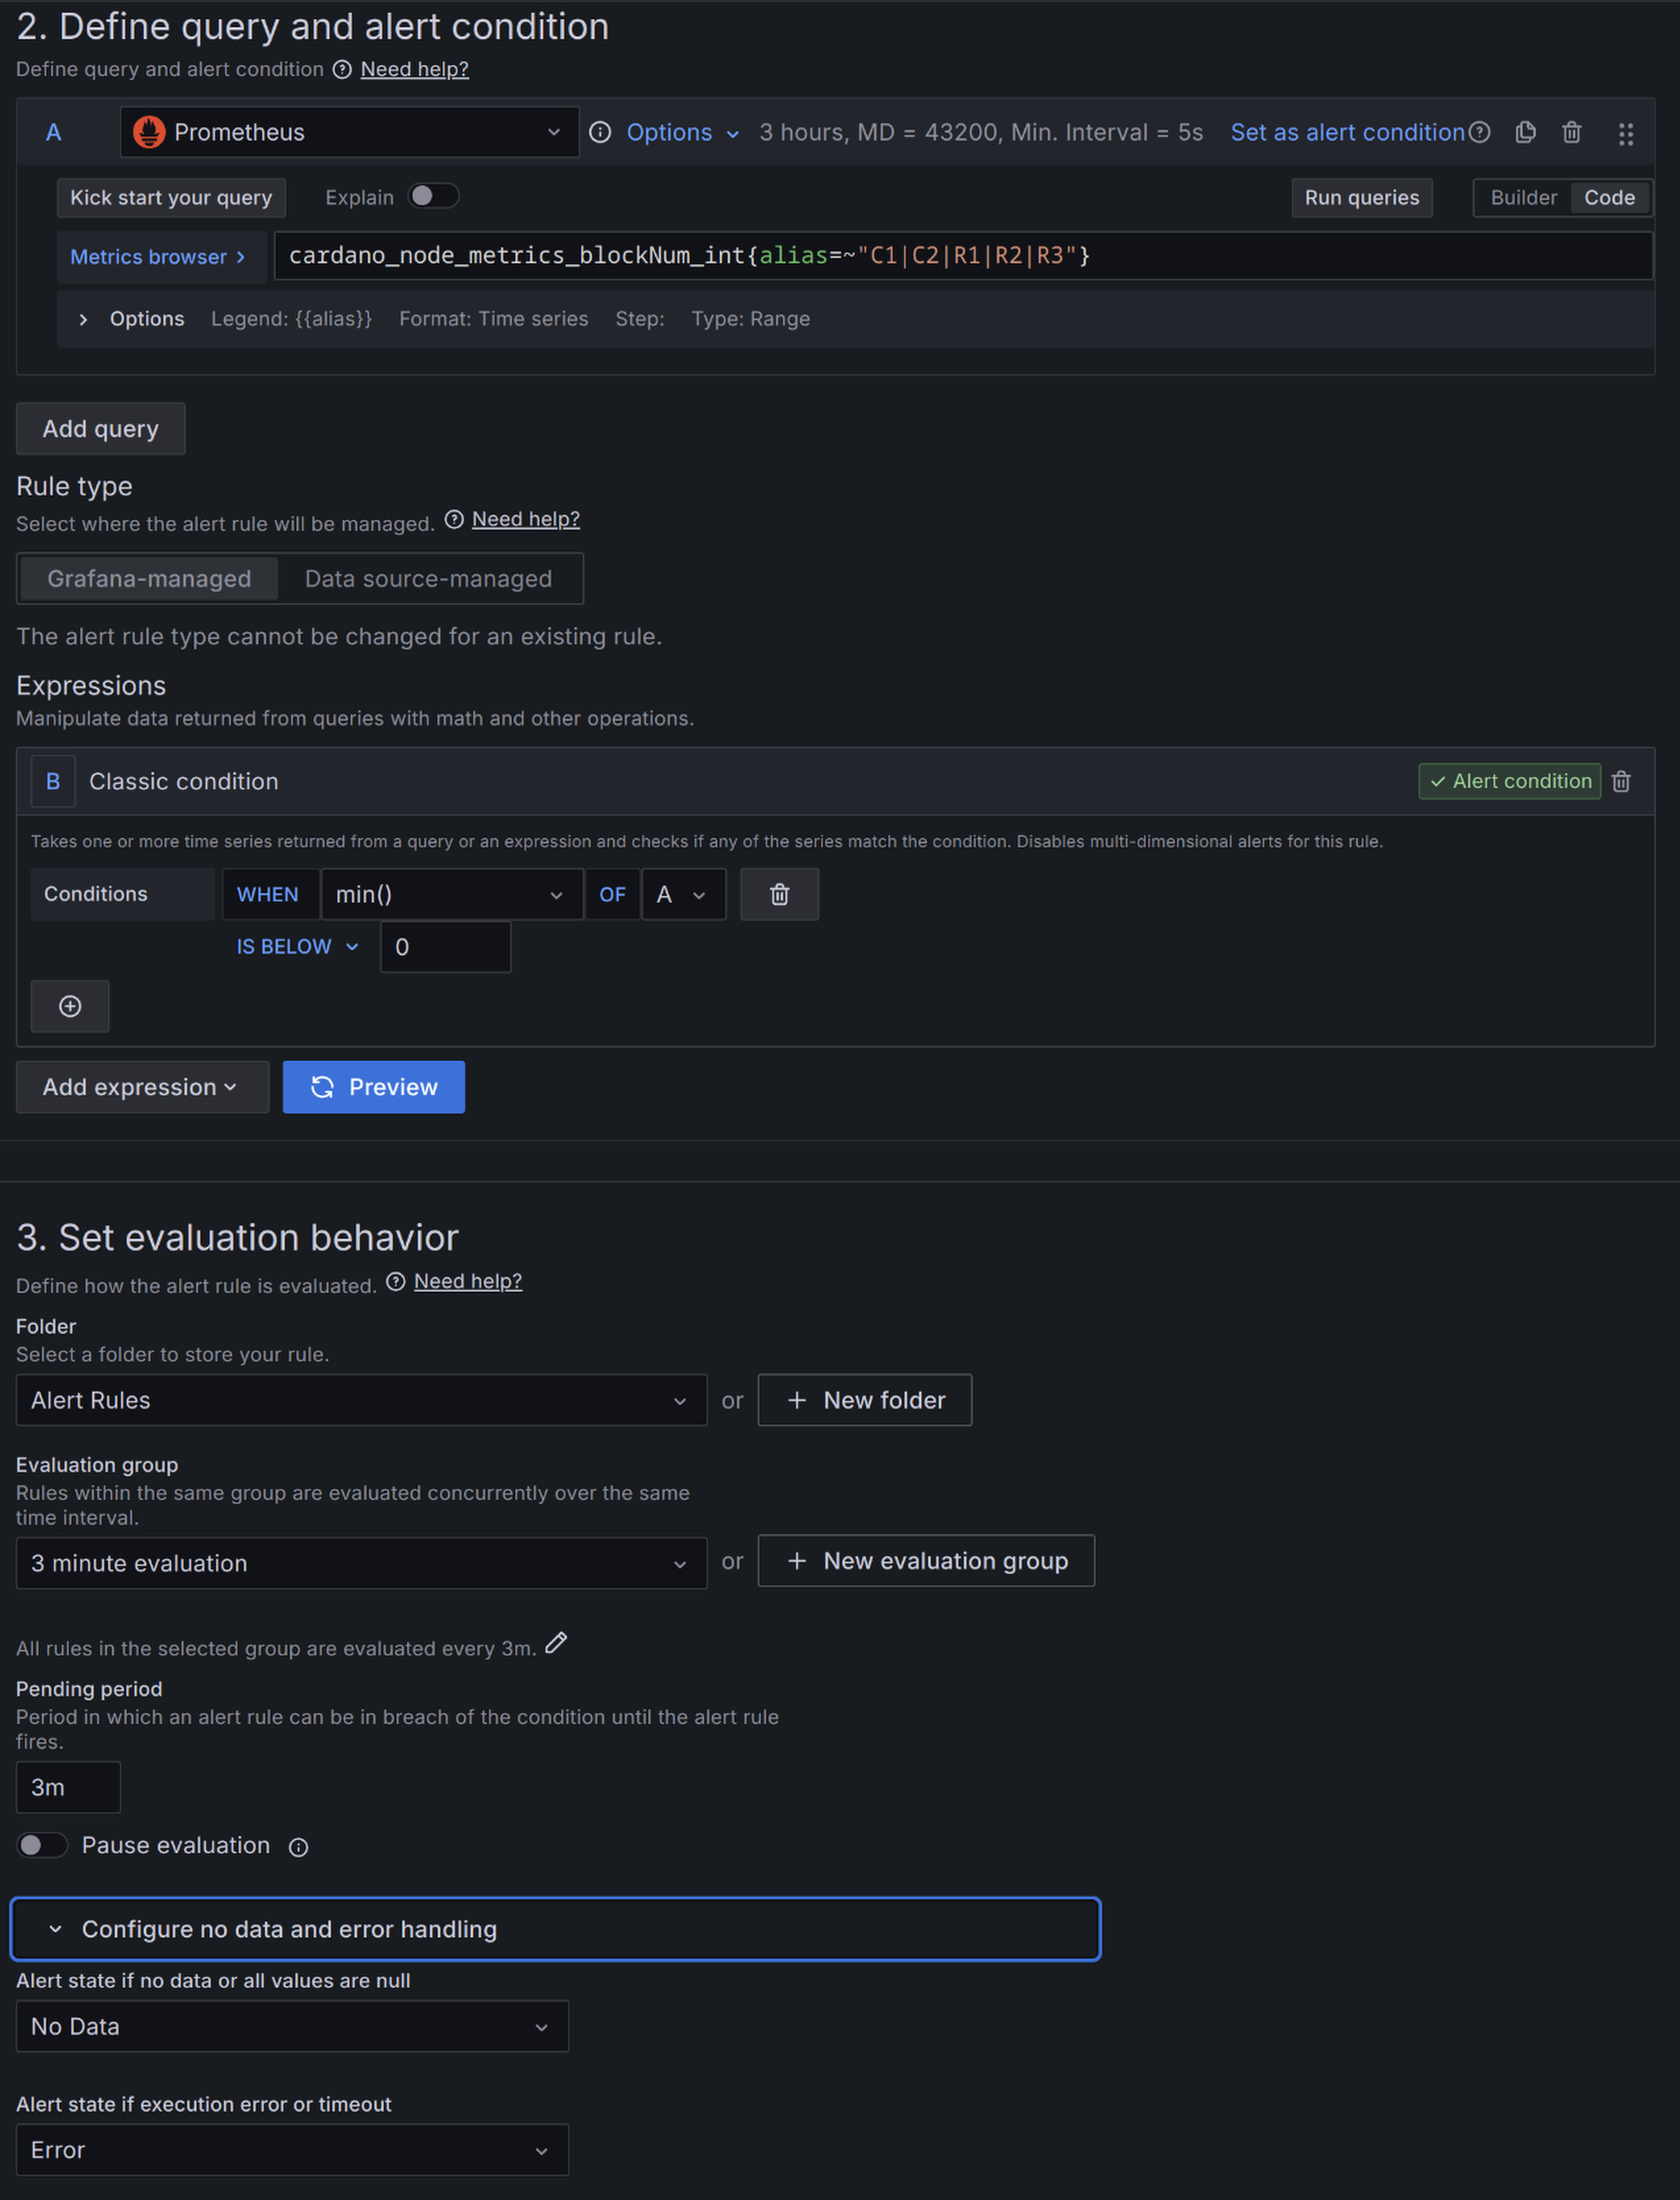
Block height stall longer than 3 minutes.
Now edit the 'Block Height' panel, click the Alert tab and make it look like this. I named this rule 'Height stall > 3m'.
Peer count.
For this one an alert will be created for each of the Peers panel. This will differ depending on the nodes role. A BP only connects to your relays. In this guide there are 3 relays connected to each BP 4 if you connect both BP's to each others topology file.
Relays on the other hand will have a much higher peer count. This is what I have on this dashboard for C1 & R1 panels.
C1-C2 Peers alert
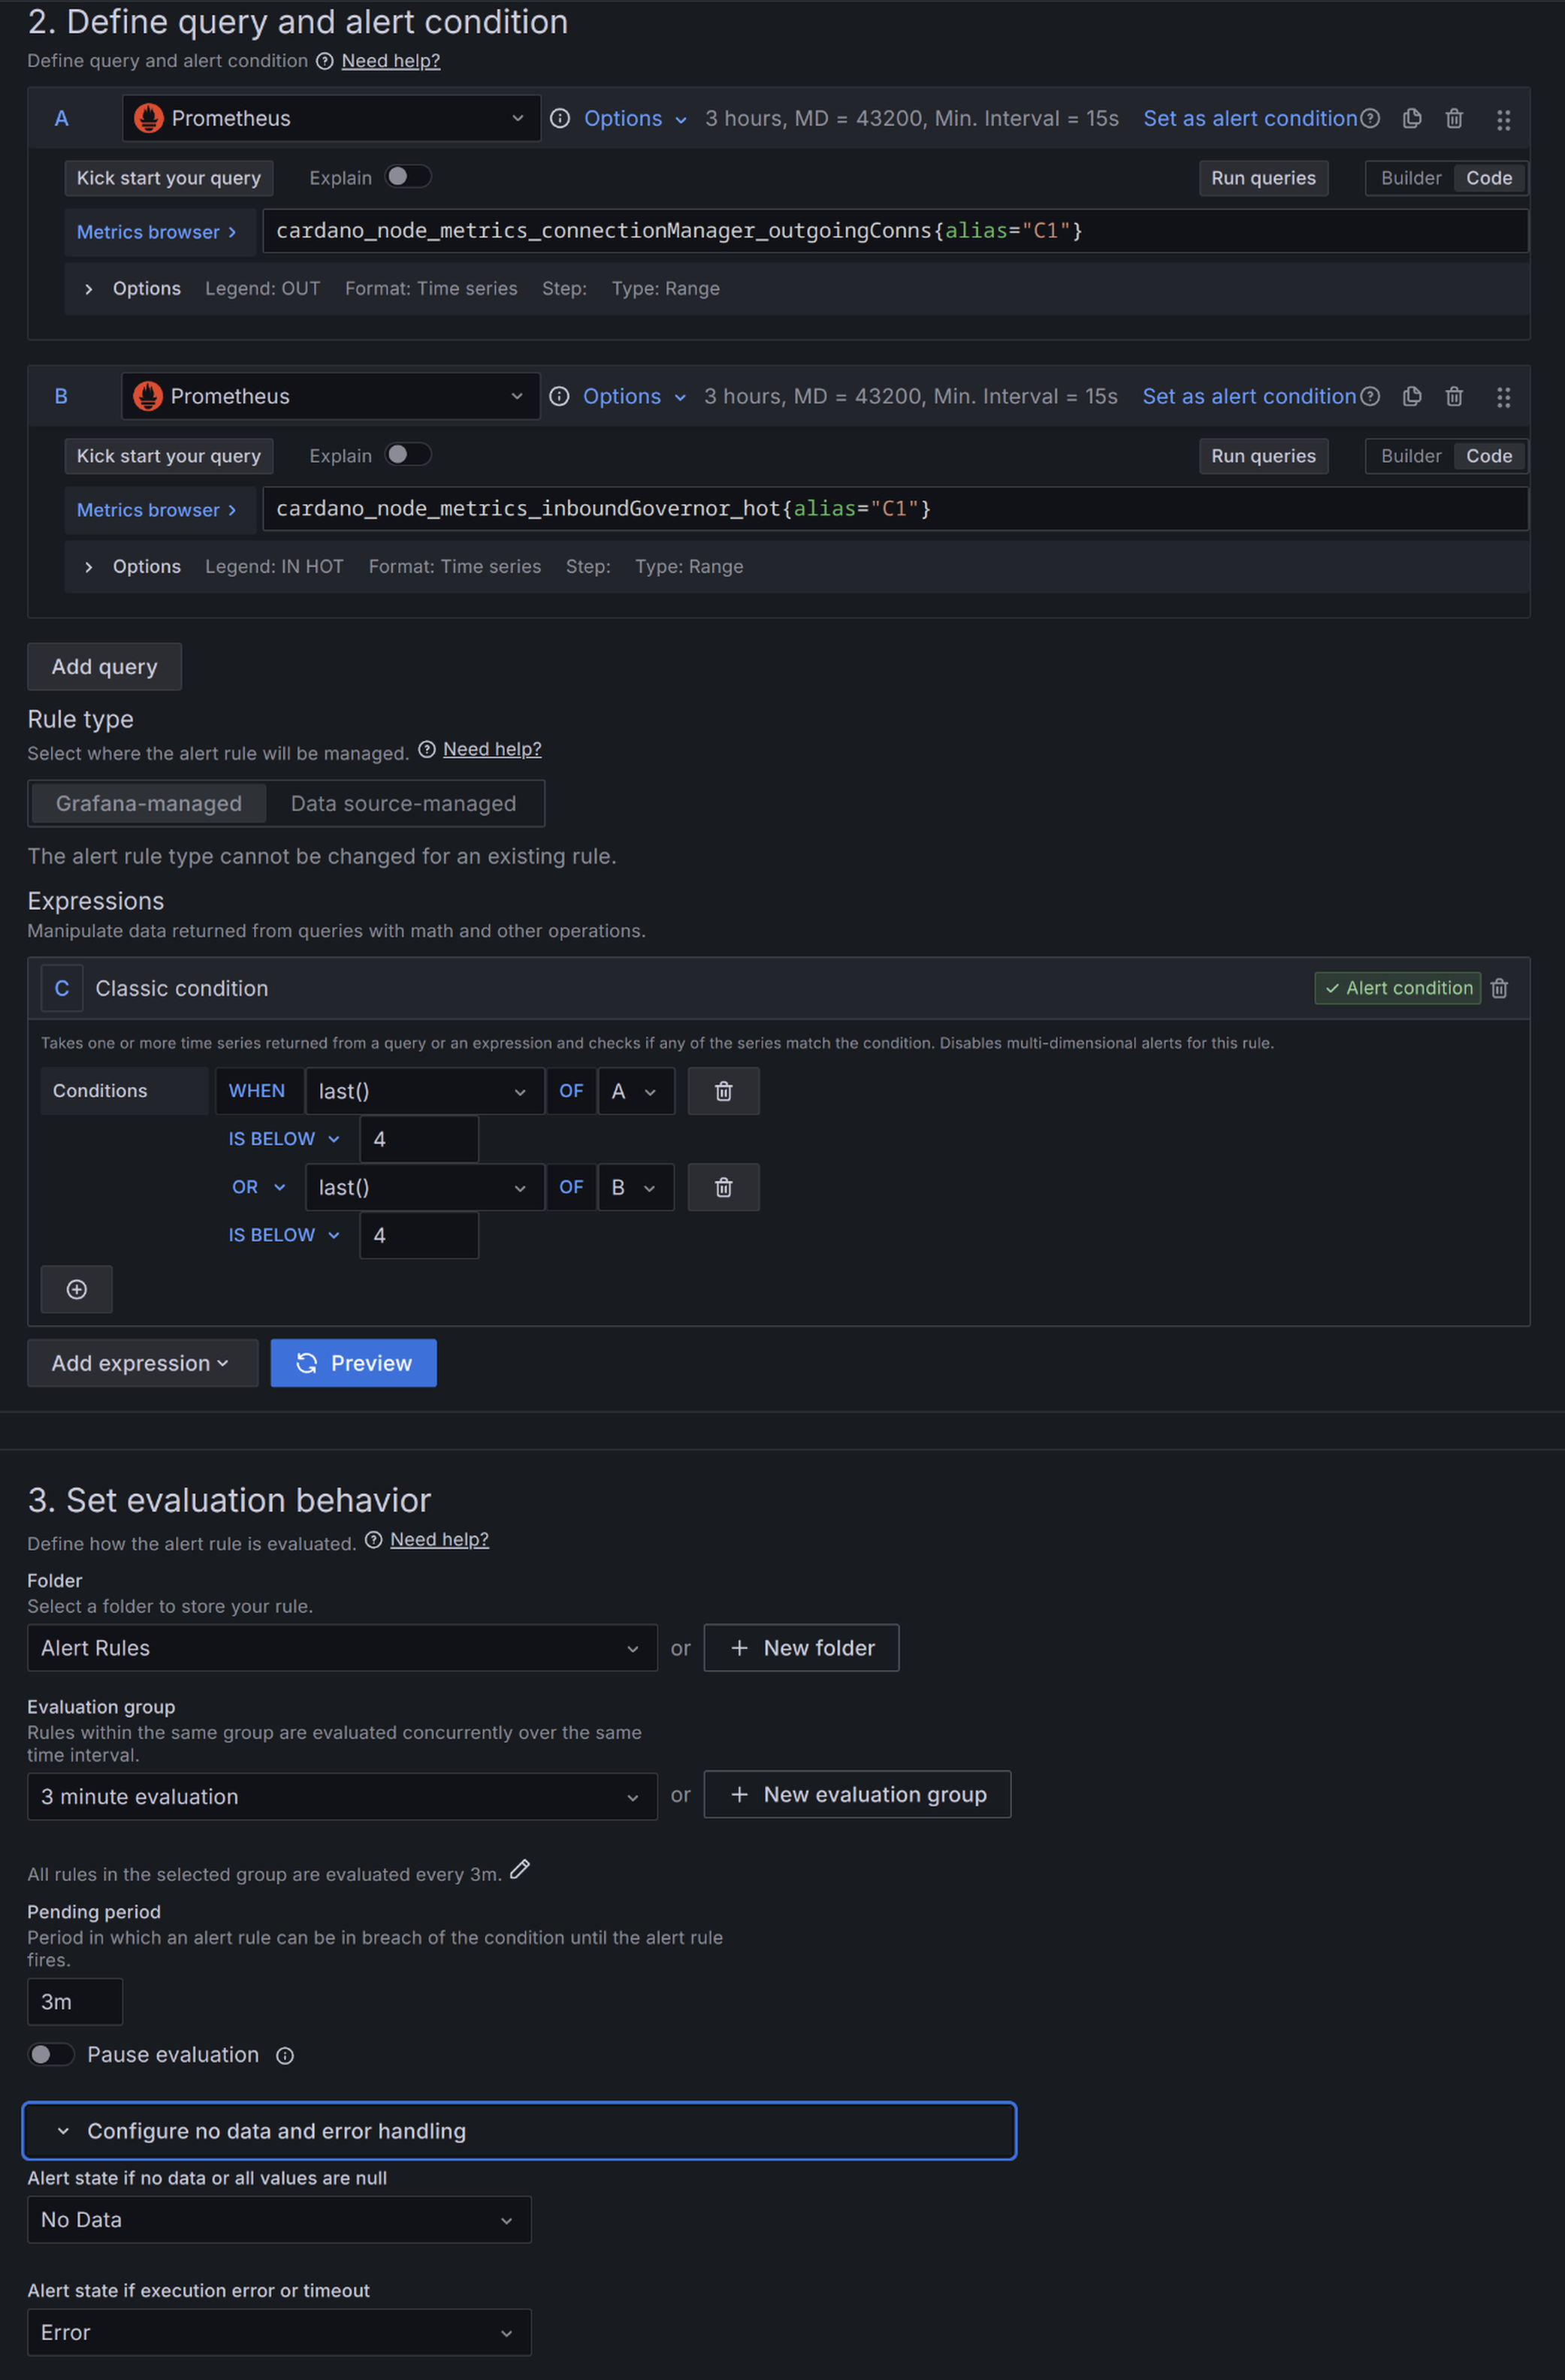
R1-R3 Peers alert